Dashboard
Overview
The Dashboard summarizes resource usage and metrics for running tasks, helping administrators and users quickly understand the platform's overall status. This section describes its main components.
Resource Overview
The resource overview summarizes the number of tasks using GPU resources within the organization. It shows running and failed task counts separately for GPU Pod, Model Service, Fine-tune, Training, and other task types.

Resource Monitoring
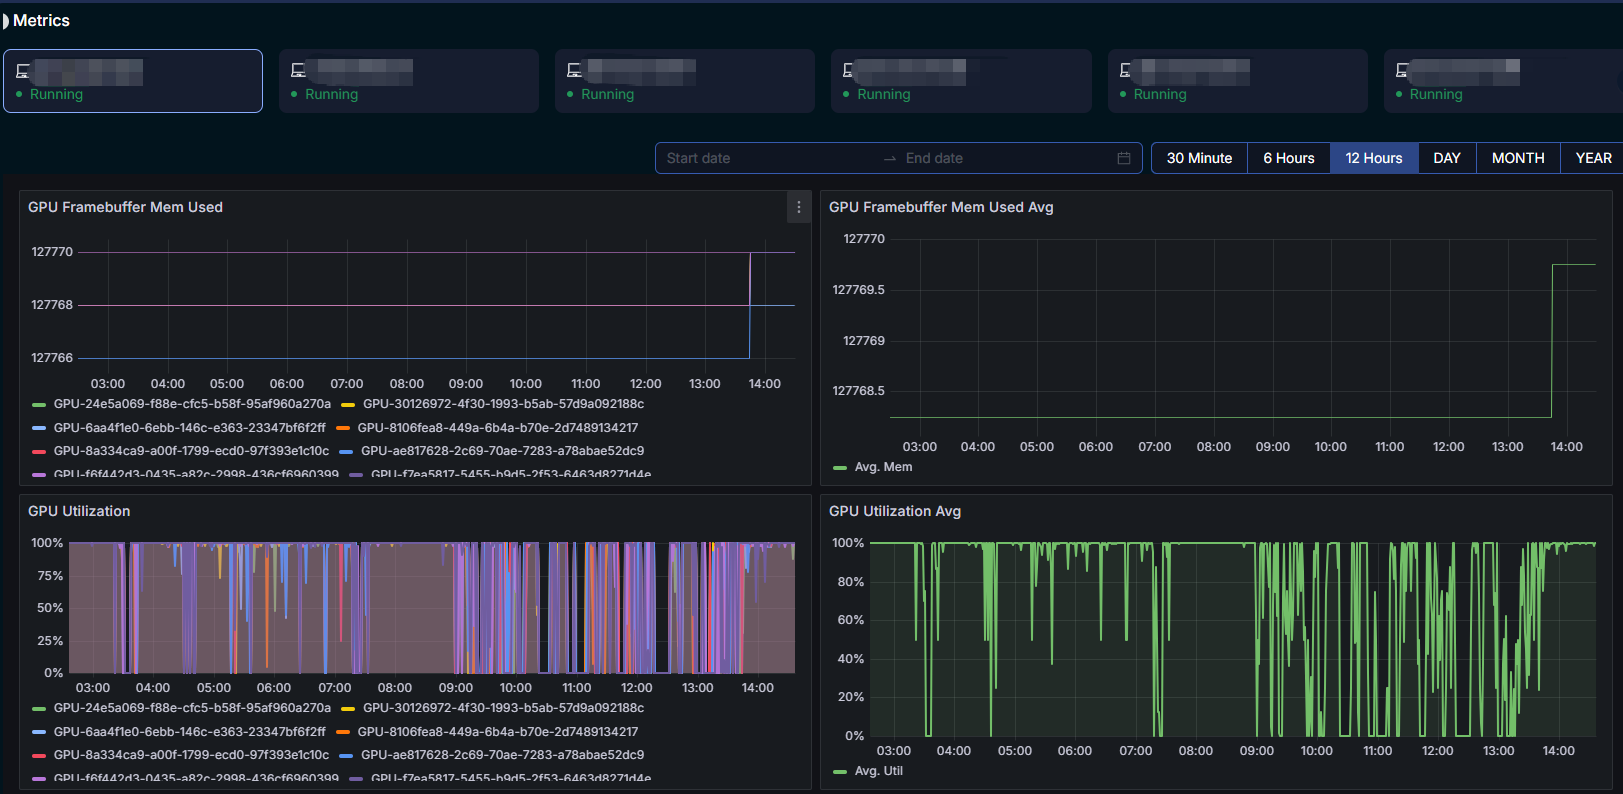
Resource monitoring summarizes CPU and GPU metrics for tasks and Bare Metal servers. Switch between MaaS and BareMetal views to see time-series charts for CPU utilization, memory utilization, GPU utilization, and GPU memory usage.

Storage and Billing
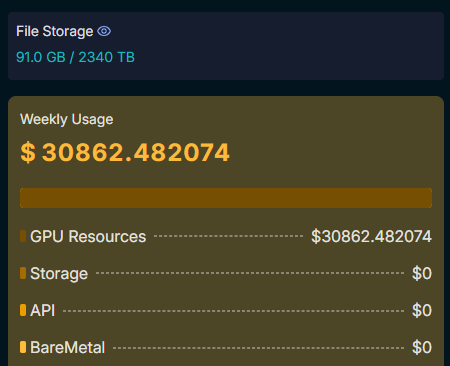
This section shows the organization's storage usage and weekly billing information, including file storage usage (for example, 91.0 GB / 2340 TB) and a summary of this week's charges by GPU Resources, Storage, API, and BareMetal. It provides a clear breakdown for reviewing costs.
Metrics
This area brings together metrics for all tasks, including CPU and GPU metrics. Select multiple tasks and filter by time ranges from 30 minutes to a year. Charts include GPU memory usage, GPU utilization, and average values for comparison and trend analysis.